Sellf Media Logo
Strategy · Creative · Media · Technology · Real Growth.

SELLF PROPRIETARY FRAMEWORK

RGI

Real Growth Index

Growth isn't what looked good.
It's what measurably improved.

More sales. Higher traffic. A larger audience. Better campaign results. Each of these can be positive. But none of them alone proves a company is truly growing. RGI — Real Growth Index is Sellf's growth index, developed to measure how much real progress a brand has made from the starting point defined by BHS.

How RGI Works
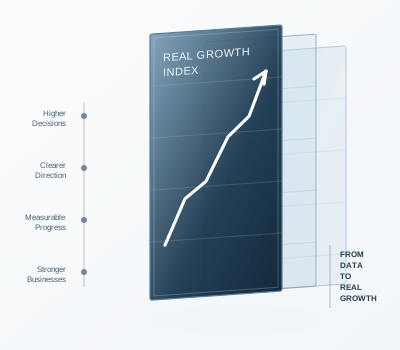
RGI Real Growth Index visual

RGI AT A GLANCE

Not a performance score. A progress measure.

RGI is not a static performance score. It takes the starting point defined by BHS and measures change over time, showing how much each result truly moves the company forward.
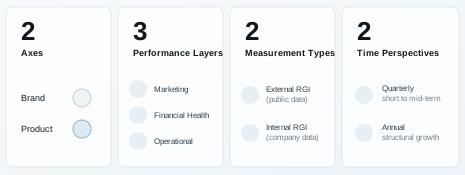
RGI at a glance

BHS → RGI

First we define where we are. Then we measure how much we really improved.

BHS and RGI serve two different roles in the same measurement system. BHS defines the starting point. RGI measures the change from that point in quarterly and annual periods.
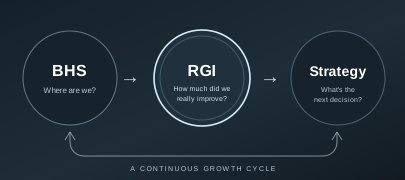
BHS to RGI growth cycle

TWO AXES

Growth happens in more than one place.

RGI evaluates company performance across two main axes, then brings them together to understand real growth.
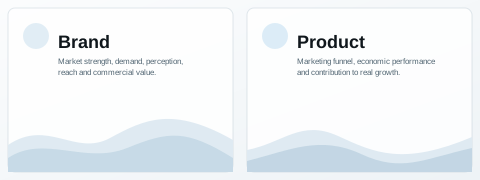
Brand and Product axes

THREE PERFORMANCE LAYERS

Beyond visibility, what actually changed?

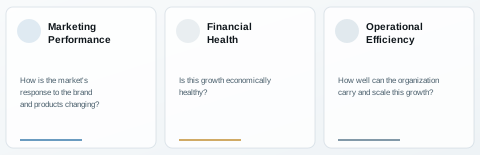
RGI evaluates growth across three core performance areas.
RGI performance layers

FUNNEL WIDTH

Healthy growth doesn't happen in just one stage.

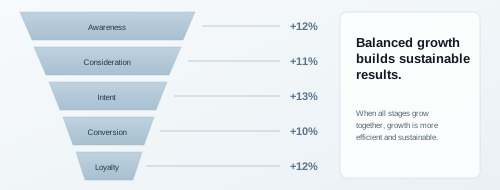
RGI measures the efficiency of the entire funnel by looking at how consistently each stage grows. It's not about which stage grows the most, but whether all stages grow together in a balanced and sustainable way.
Balanced funnel growth example

EXTERNAL RGI

Measurable growth from the outside.

External RGI uses publicly available and verifiable data to evaluate Brand and Product across Marketing Performance and Financial Health.

INTERNAL RGI

A deeper view with company data.

Internal RGI includes operational efficiency by using the company's real data. This allows us to evaluate not only demand and financial results, but also how well the organisation can sustain and scale the growth.

QUARTERLY + ANNUAL

Growth is not a snapshot.

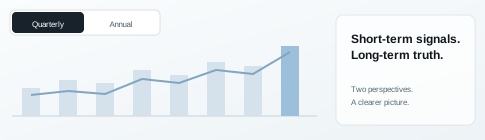
Quarterly RGI shows short and mid-term change. Annual RGI reveals structural growth. Together, they show not only the result, but the direction and quality of growth.
Quarterly and annual RGI growth view

MORE THAN A REPORT

A decision system.

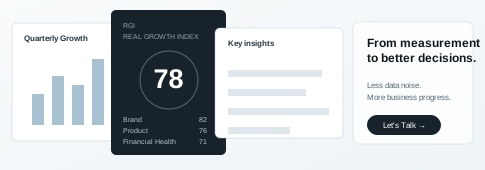
RGI reveals where real growth exists, where there is only metric increase, which areas move the company forward, and where focus should shift next. Because the value of measurement is not a report. It's a better next decision.
RGI decision report output

SELLF PROPRIETARY FRAMEWORK

RGI

Real Growth Index

Growth isn't what looked good.
It's what measurably improved.

Sales, traffic, reach or campaign results do not prove real growth on their own. RGI — Real Growth Index is Sellf's growth index, developed to measure how much brand and product performance has truly progressed from the baseline defined by BHS.

Real Growth Index
BaselineProgressGrowth

RGI AT A GLANCE

Not a performance score. A progress measure.

RGI is not a static performance score. It uses the BHS baseline as its reference and measures change over time, showing whether each result actually moved the company forward.

2
Axes
Brand
Product
3
Performance layers
Marketing
Financial
Operational
2
Measurement types
External RGI
Internal RGI
2
Time perspectives
Quarterly
Annual

BHS → RGI

First we define where we are. Then we measure how much we really improved.

BHS defines the starting line. RGI tracks the change from that baseline in quarterly and annual periods. Growth becomes a repeatable measurement system rather than a one-off campaign result.

BHS
Where are we?
RGI
How much did we improve?
Strategy
What's the next decision?

TWO AXES

Growth happens in more than one place.

RGI evaluates company performance across Brand and Product, then brings both axes together to understand real growth.

Brand

Market strength, demand, perception, reach and commercial value creation.

Product

Marketing funnel, economic performance and contribution to real growth.

THREE PERFORMANCE LAYERS

Beyond visibility, what actually changed?

The full RGI system reads growth across marketing, finance and operations. Marketing performance can improve while financial or operational health deteriorates at the same time.

Marketing Performance

How is the market's response to the brand and products changing?

Financial Health

Is this growth economically healthy?

Operational Efficiency

How efficiently and sustainably can the organisation carry this growth?

BRAND — MARKETING PERFORMANCE

Is the brand actually getting stronger?

We do not evaluate brand performance through reach or follower count alone. External RGI reads real market movement through five core signals.

01

Trend Adaptation

Visibility within category trends and annual demand shifts.

02

Positive Comment %

Positive perception within review and mention volume, benchmarked against competitors.

03

Traffic-Based Market Share

Estimated category traffic share and traffic quality where observable.

04

Marketing KPI / Result Focus

The result created against the campaign's actual target.

05

Advocacy Share

How much of the loyalty-stage audience recommends, shares or visibly supports the brand.

BRAND — FINANCIAL HEALTH

Does growth have an economic return?

Looking bigger and growing economically are not the same thing. RGI separates nominal increases from signals of real financial health.

Expense / Revenue Structure

The share of total expenses within revenue.

Net Profit Margin

How true profitability changes as the company grows.

Unforeseen Costs

The share of unexpected costs within the overall cost structure.

Real Revenue Growth

Revenue development after accounting for inflation.

PRODUCT — MARKETING PERFORMANCE

A product is not healthy just because it sells more.

RGI reads product growth through Funnel Width and Funnel Depth. The goal is not to reward a spike in one stage, but to understand whether the funnel is expanding together in a balanced and sustainable way.

FUNNEL WIDTH

Healthy growth doesn't happen in just one funnel stage.

RGI tracks percentage change from the BHS baseline across Awareness → Consideration → Intent → Conversion → Loyalty. The real measurement is how close those growth rates are to one another.

RGI does not ask: Which stage grew the most? It asks: Is the whole funnel growing together at a healthy rate?
Balanced growth
Awareness
+12%
Consideration
+11%
Intent
+13%
Conversion
+10%
Loyalty
+12%
Unbalanced growth
Awareness
+5%
Consideration
+6%
Intent
+7%
Conversion
+30%
Loyalty
+8%

FUNNEL DEPTH

What happens after the sale?

Funnel Depth evaluates Loyalty and Advocacy on an annual horizon. Real loyalty is not created by a few weeks of campaign performance; it is proven through repeat purchase, recommendation and advocacy over time.

Loyalty
Advocacy

PRODUCT — FINANCIAL HEALTH

Is the product actually creating value?

High sales volume does not automatically mean healthy product economics. RGI evaluates how sustainably a product carries growth financially.

Gross Profit
Gross profitability relative to the industry benchmark.
Marketing Efficiency
Relationship between acquisition/sales targets and allocated marketing spend.
Production / Service Cost
The economic load created by production or service delivery.
Capacity vs. Result
Whether operations can actually fulfil the demand marketing is designed to create.

GOAL-BASED WEIGHTING

Not every KPI carries the same weight for every company.

Within External RGI, Marketing Performance carries 60% and Financial Health 40%. Brand and Product weighting changes with the primary KPI: Brand carries 60% for brand-led objectives, while Product carries 60% for conversion-led objectives.

KPI weighting reflects the company's objective; funnel efficiency measures balance between stage growth rates. They are not the same thing.

Layer weight
Marketing Performance60%
Financial Health40%
Axis weight
60
Brand-led KPI
60
Product-led KPI

EXTERNAL RGI

External RGI

Uses public and verifiable data to measure Brand and Product across Marketing Performance + Financial Health. The goal is not a perfect outside-in model, but a consistent and comparable growth signal.

Public data
real insights

INTERNAL RGI

Internal RGI

When company data enters the system, the view becomes deeper. Operational Efficiency joins Marketing Performance and Financial Health, allowing RGI to evaluate how well the organisation can carry and scale growth.

Company data
deeper decisions

QUARTERLY + ANNUAL

Growth is not a snapshot.

RGI uses two time perspectives to separate short-to-mid-term movement from structural progress.

QuarterlyAnnual

Quarterly RGI

Shows short- and mid-term movement, direction and whether strategy is progressing as intended.

Annual RGI

Evaluates brand strength, financial health, funnel depth and long-term change from a more structural perspective.

MORE THAN A REPORT

Not a dashboard. A decision system.

The value of RGI is not more charts. It is making the next decision clearer.

Where is real growth happening?
Where is there only metric growth?
What is dragging growth down?
Where should resources move next quarter?
Quarterly Growth
RGI / Real Growth Index
78
Brand82
Product76
Financial71
Key insights

THE RGI PRINCIPLE

Vanity metrics do not prove growth.

If traffic, reach or sales rise while margin falls, loyalty weakens, acquisition cost runs out of control or operations cannot scale, the company may not have truly grown.

Success is not one metric moving up. It is measurable progress created across the system as a whole.

BHS + RGI

Baseline → Progress → Real Growth

BHS gives us the baseline. RGI measures what changed from that point. Repeated over time, growth stops being an assumed outcome and becomes a system that can be measured, learned from and managed.

BHS
Baseline
RGI
Progress
Real Growth

THE SELLF MEASUREMENT SYSTEM

Measure real growth. Not growth that only looks good.

Companies do not need more data. They need to understand what their existing data means. RGI turns complex performance signals into answers to a small number of fundamental questions.

Did we really grow?
What caused it?
What should we change?
you can book a meeting with us right away!